.png)

NPS is, to be frank, quite a blunt metric. It does not give actionable insights that would help improve customer experiences, just a hint on if something is going well or not so well. It’s just an indicator – NPS does not help you to gain competitive advance or create outstanding customer experiences, because NPS does not tell you why something is happening, it only shows you the result. To really get a grip on what’s going on, you need sharper metrics: KPIs aka Key Performance Indicator and KEIs aka Key Experience Indicators.
KPIs vs. KEIs – What's the difference between the two?
In some cases, KPIs and KEIs overlap but KEIs are more user-centered and measure the quality of experience, value, and outcomes. KEIs place the emphasis on understanding how users are interacting with your service, and they help identify potential issues, focus on understanding underlying problems and root cause, and improve your product or service. KEIs are functional and provide quantitative actionable insights.
KPIs, on the other hand, are more business-centered and tend to focus on delivery process effectiveness and efficiency. KPIs, in a customer experience context, provide insights to operational and finance teams helping to improve operational model, identify most valuable customer segments, and improve profitability. KPIs seldom give you the level of detail required to make actual service improvements.
Examples of KEI's you might want consider monitoring and why they are important
aNPS
aNPS aka ‘actual NPS’ is a freshened view on the basic NPS – instead of NPS asking users if they would recommend your services, aNPS asks if the users already have recommended your services. aNPS gives a more accurate view on the happiness of your customers as it removes the future speculation from replies.
Percentage of Satisfied Users
Percentage of Satisfied Users can be found out by comparing the total number of your users and seeing the results of the satisfaction score. It gives you insights on how many users in your existing customer base are content with your services.
7-Day Active Users
7-Day Active Users informs you of the number of active users who were using your services within a 7-day period. This is a great tool to find out if any of your marketing campaigns had impact and if the number of active customers increased due to your marketing efforts.
Number of Actions Per User
Number of Actions Per User tells how many tasks users are completing on your service, whether it’s searches, visiting subpages or making orders.
Time Between Actions Per User
Time Between Action Per User sheds light on how long of a time the users are taking between actions. Are they actively doing something or maybe bouncing back forth between doing something else and returning later? This metric indicates how committed your users are while using your service.
Adoption Rate
Adoption Rate tells you the number of users who are trying out your new feature and using it. It should be calculated for a specific time period to find out how successful your feature is and how fast your users start using it.
Time to 1st Action
Time to 1st Action is as simple as it sounds: how much time does it take for your users to take their 1st action within your service. It gives you an idea how appealing or easy-to-use your service is.
Percentage of Users Who Performed Action for the 1st Time
Percentage of Users Who Performed Action for the 1st Time is also pretty self-explanatory – it tells you how many of the visitors on your service actually did something with your service. By comparing this number to the total count of users/visitors, you’ll find out how tempting your service is.
Retention Rate
Retention Rate reveals the percentage of customers who continue paying for a product over a given timeframe aka are active users. It’s especially useful for SaaS type of service providers or retail companies whose customers buy the same products regularly.
Upgrade Rate
Upgrade Rate tells you how many of your users are willing to pay you more and update their subscription to a more costly but also a better and more versatile service. It measures the desirability of your more priced products.
Time to Churn
Time to Churn tell you how fast your customer become numbers in churn rate – which means the total percentage of customers who stop doing business with you within a certain set time period. This metric tells you how fast your customers turn into lapsed users.
Task Success Rate
Task Success Rate states the number or users who were successfully able to complete a task within your service, e.g. completing a web shop purchase. It is calculated based on the average of all users, in a given time period, for all tasks that the users are able to perform. This metric gives insight on the usability of your service.
Time-on-task
Time-on-task measures the time your users are taking to perform set tasks within your service. With Task Success Rate, this metric gets you to the roots of the usability and ease-of-use of your service.
Lostness
Lostness tells you how lost your users are when they are trying to perform a task on your service, e.g. finding contact information. To measure lostness, you should do usability testing.
Abandonment Rate
Abandonment Rate measures how many users leave a website or hang up from a customer help center before they receive assistance. It’s a useful metric to find out how many people are discontent or impatient to leave your service before getting help.
The many benefits of measuring experience and implementing KEIs
If the above list was not enough to convince you of why measuring experience is so vital, here are a few more arguments.
First of all, KEIs provide information to decision-makers to drive product and/or service decisions. They also precede or predict business outcomes and anticipate and prevent potential problems.
KEIs also evaluate relative importance of qualitative findings and customer anecdotes through quantitative research. They help with identification: identifying problem areas that need deeper understanding through qualitative research, and identifying strengths, weaknesses and individual features of a product or service.
KEIs help you to understand the effect of a change in a product or service and understand the value of a product or service and the predictors of customer loyalty.
All in all, KEIs provide you a solid baseline of experience quality to measure improvements and their impact.
Product / service focus: How to choose what to measure with KEIs
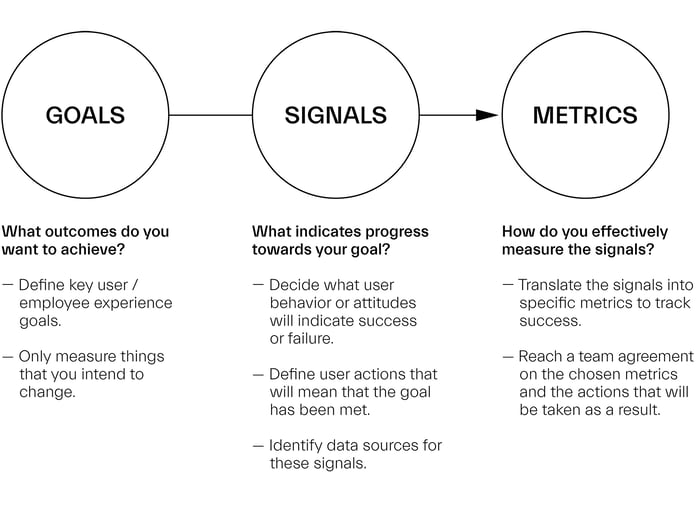
When making decisions on what to measure, you need to take a look on three aspects first: goals, signals, and metrics.
With goals, you should think of what outcomes do you want to achieve. Define your key user or key employee experience goals, and only measure things you actually intend to change.
With signals, you need to think of what indicates progress towards your goals. Decide what user behaviors or attitudes will indicate success or failure and define user actions that will mean that the goal has been met. Identify data sources for these signals.
With metrics, contemplate on how you effectively measure the signals. Translate the signals into specific metrics to track success and reach a team agreement on the chosen metrics and the actions that will be taken as a result.
After defining your goals, signals, and metrics, you can take a closer look on what actual KEIs to measure. One option is to use four categories (adopted from Google HEART-model) and you should choose metrics from each to help you measure progress against your goals. The KEIs can be measured at a product or feature level.
The categories are happiness, adoption and retention, engagement, and task success.
Under Happiness you find Attitudinal metrics that measure subjective aspects of the experience, e.g. satisfaction, visual appeal, likelihood to recommend or perceived ease of use.
Under Adoption and Retention you should Measure new users and returning users, which provides more insights into how many new users started using the product and how many users are still using the product in a given time. Generally, it’s more useful for new products and services or undergoing design.
Under Engagement focus on Measuring user involvement, which often are behavioral proxies such as frequency, intensity or depth of interaction over a period of time. Generally, it’s more useful to measure average per user instead of total count.
Under Task success, include traditional metrics such as efficiency (time to complete a task) and effectiveness (number of tasks completed), and error rates and measure how closely users follow an optimal path.
Moving Forward to Making Decisions - What It Takes?
To make informed decisions about improving your customer experience, you need to combine quantitative and qualitative insights in the context of end-to-end journey.
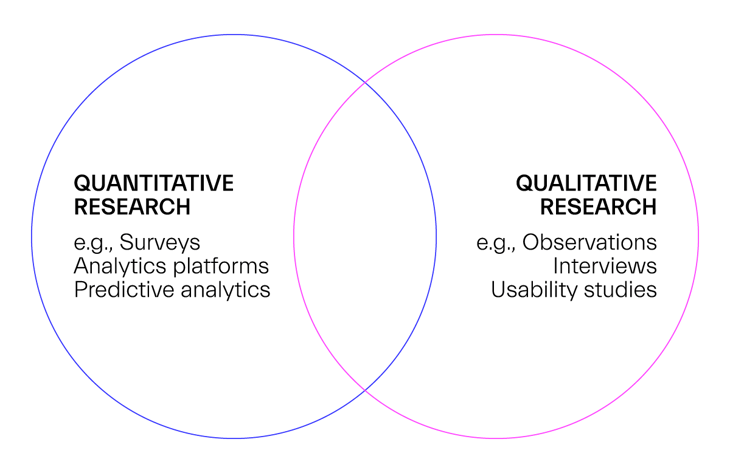
Quantitative insights are needed to understand where the issues are and what is their relative importance, and qualitative insights are needed to understand the underlying problems and their root causes. The context is needed to understand how it fits in the overall experience and potential dependencies.
We at Siili can offer you help with combining these three, in the form of a metric workshop in which we’ll identify clear metrics, scope, goals, and signals with you. If you’re interested to hear more, don’t hesitate to contact us.
Written by Kenneth Lindfors & Leena Viitanen