.png)
There are several ways to describe and implement the architecture for near-real-time pipelines. For example code for Data Ingestion (the code interfacing with the external API) can be implemented as Azure Functions App, Web App, or as A Logic App, if a low code solution is preferred.
In this demo we ended up implementing it as a .NET Core application running as a docker container hosted in an Azure Container Instance.
Why this choice? There are several benefits, the most important one being that using own code gives us the most flexible way to enhance architecture in future. For example, if we want to create a resilient distributed architecture with Kubernetes, the migration path is easy. At minimum, we only need to move the container instance to Kubernetes, and if we want to split the code to several containers, that can be easily done with good designed .NET Core application. Using .NET Core gives us also a flexible environment with basically unlimited opportunities to enhance functionality.
After data has been ingested, we send data to Azure Event Hub, which is an excellent Azure tool to passing events between the components. Azure Event Hub can also persist events up to 7 days, which increases the resiliency of the overall architecture.
For Data Refinery we chose the Azure Databricks Service. Databricks is currently the hottest data refinery tool in Azure world and beyond. Based on Apache Spark, it provides a flexible and distributed computing platform both for data scientist and data engineers. It can act as a technical platform for complex data science problems, act as an advanced ETL tool and handle the streaming, real-time data as well. Further, Databricks supports Python, R and Scala. In this article all examples are implemented with Python. For more complex scenarios you may want to use Scala as well being more performant choice.
For data storage we utilized the relatively new Databricks Delta tables. Delta tables are currently under preview in Azure platform but is already a feature stable enough to be used in this demo. When storing data to delta tables instead of external storage we reduce the overall complexity of the system, but for production use cases you may consider for example Azure Cosmos DB, Azure Data Lake Store gen2, or Azure SQL Data Warehouse, depending on your use case.
For publishing we use Power BI, which gets the data from Databricks Delta Tables directly, but in real production cases it may get data e.g. from Azure SQL Data Warehouse or other sources.
So giving these options, the architecture of this demo application is as follows:
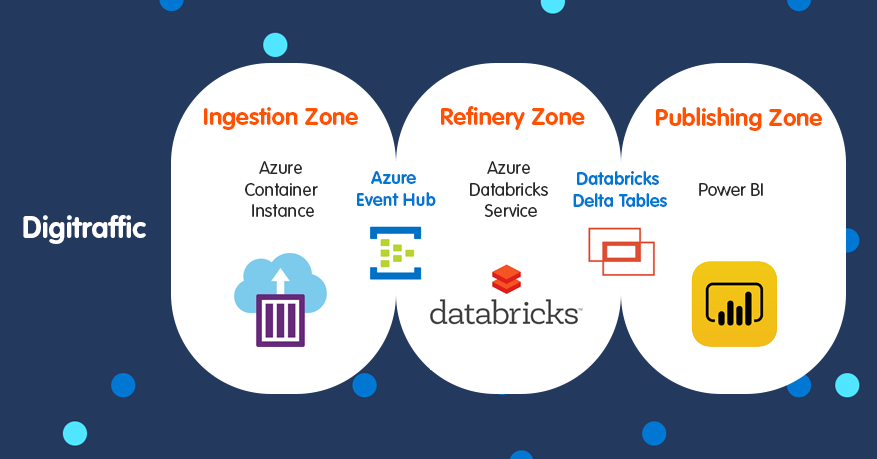
What we need to do next:
- Set up Azure Databricks to listen events in the Event Hub and pass the data to Databricks Delta Tables.
- Implement the ingesting container application to interface with Digitraffic open API.
- Define necessary tables and views in Databricks Delta Tables for easy reporting.
- Design the Power BI visualization.
If we want to read data from Event hub, we need to get an Event Hub connector for Databricks. Event Hub connector is a open source project hosted in GitHub. It is possible of course to compile the code from the very start, but especially if you are using Python in Databricks, the best and easiest way is to install the connector from Maven Central.
In this demo we load the libraries under the Shared folder so that the same library can be shared for different applications using Azure Event Hub.
Point your mouse on top of Shared folder as shown in Figure 2, right click and select Create -> Library
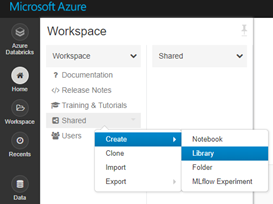
Figure 2: Creating Library to Shared Folder
Then select Library Source to be Maven, and enter Maven Coordinates for Azure Event Hub:
azure-eventhubs-spark_2.11-2.3.11
After you insert Maven Central Coordinates, press Create. The system will automatically resolve the needed dependencies and download those packages as well. Automatic dependency management is one of the main benefits of using Maven to install libraries instead of installing them manually.
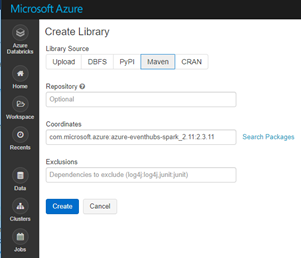
Figure 3: Ready to install the connector from Maven Central
Now after we have Azure Event Hub connector installed in the Databricks, we are ready to write the code reading data from the Event Hub, transforming it, and writing to the destination sink.
Databricks supports Scala, Python and R languages. Databricks is based on Apache Spark which is implemented by using Scala, which makes typically Scala the best choice when performance is a top priority. However, In order to read from EventHub, we need an Event Hub connection string, which can be get from Event Hub blade in Azure portal.
connectionString = <connectionString here>
ehConf = {}
ehConf[‘eventhubs.connectionString’] = connectionString
The connection string is all what we need for our streaming application in this blog, but there is actually a number of options which can be used, for example if you need to start reading in the middle of the stream, you can set offset to point to a specific messages and so on.
After configuration has been done, it is time to write a notebook. Go to WorkSpace under Home and by right-clicking in your home directory, select Create Notebook.
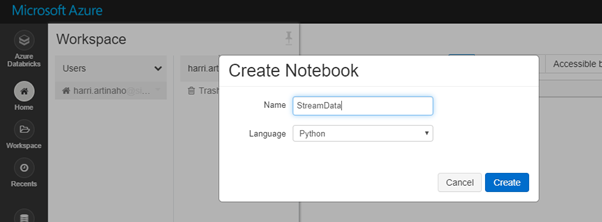
Figure 4: Create Notebook
In order to connect to Event Hub, we need to provide the connection string to Event Hub. Event Hub connector accepts a variety of configuration options, for example we can define the exact sequence number or DateTime when message is enqueued. In this demo we only provide the EventHub connection string:
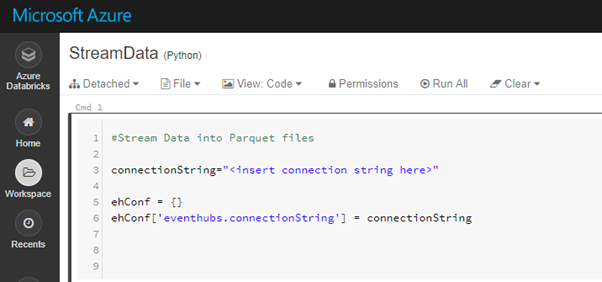
Figure 5: Event Hub connection string configuration
The configuration array ehConf is given as a parameter to options method, so that streaming machine can point to the correct Event Hub.
We start the process by reading data flowing from Event Hub to a construct called DataFrame. DataFrame is a Spark internal construct, which loosely is corresponding a table in a traditional database; however a spark dataframe is able to store also nested and array data in its cells.
Dataframe is an abstract construction, and acts as a main method in the latest Spark versions to distribute data between control and worker nodes. In this demo we load the data coming from Event Hub into a dataframe, do the necessary transformations, and then save the transformations to a Parquet file in the Data Lake for further processing in the demo application.
The result of this process is that we can basically code very little and Spark engine on the lower levels will take care of serialization/deserialization, processing and a bunch of other things to get the job done.
The reading of data into a dataframe is done with the following code:
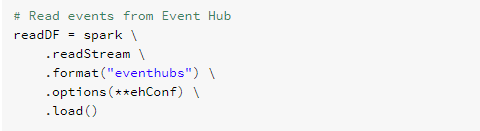
Figure 6: Reading data from Event Hub into a Dataframe
The code calls a readstream method in spark context )which is a default context available in all Spark notebooks) and tells that we are expecting data in eventhub format. Then we give the connection string as options (**ehConf) notation which is basically an array, and finally we want to load the data in with load().
Now on a code level we can think that data has been loaded, but in fact Spark processing is based on lazy evaluation and creating execution plan based on the whole code, so in fact no data loading is really happening. This is a great abstraction for a developer as we do not need to solve the problem of how to load possibly millions of rows into a dataframe, but we can focus on solving the actual problem.
After data has been ‘loaded’ to readDF dataframe, we need to do some processing. Payload data from the event hub is in binary format, so what we need to do is to cast it into a string format with the expression illustrated in the Figure 6. In addition to payload data, the event hub is sending some metadata, like the time when event for queued, partition related data and so on. In this demo we are interested only on the payload data, so we do select(“body”) to get only the payload into bodyDF dataframe.
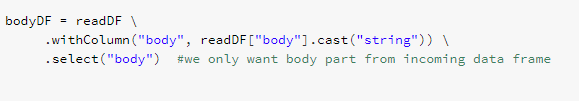
Figure 7: Processing Azure Event Hub message
When data is read to a data frame, we could do a variety of transformations for the data. In this application we want to enrich the real-time road information data with more static reference data, so that the data can be then meaningfully reported in Power BI.
When storing a large amount the data, it is important to partition the data based on some criteria. Partitioning of data makes querying it faster when the amount of data is huge, and when the partition key has been correctly defined. This is a typical case with real-time data, as data is ingested fast, and we want to store all the data for future analytical use.
Normally using DateTime or some variation of it consists a good candidate for a partition key, as queries are typically done over a time frame. Using DateTime as a partition key also helps to solve data issues later on, as we can locate faulty parquet files easily by browsing to a correct folder.
So how to create a partitionKey? One good candidate is to use the field ‘enqueuedTime’, which is generated by the Azure Event Hub. In order to make it more usable as a partition key, we want only to use ‘Date’ part of it. To get the data part, we use pyspark function to_date():

Figure 8. Adding a partition key column to a data frame
After creating the partition key, we are ready to store data to the delta tables.
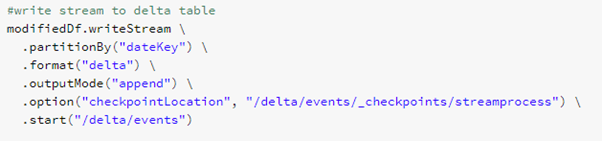
Figure 9: Storing data to Delta
- writeStream tells Databricks that we want to write the stream data frame somewhere.
- partitionBy tells that we want to partition the data based on some key – in this case it is the month-day combination we created in the previous phase.
- outputMode sets the way how we want to write the data. When set to append only new rows are written to output sink, which is the default output mode.
- option checkpointLocation tells the writer where to save checkpoint information. This is an internal bookkeeping functionality by Databricks / Spark and enables the process to recover easily in case of failures.
Finally we start writing with start method giving the file location as parameter. The format is delta, which is basically a set of Parquet files with some additional delta internal meta data files.
This is now all we need to create a functional streaming process.
Next steps would be to feed the Event Hub with real-time data from Digitraffic service and see how the data flows in to the Delta Parquet files for further processing.
Written by
Harri Artinaho
Have you heard of our new solution tribe in Siili? We call it Siili Azure Studio and it's all about Microsoft Azure.